Understanding Standard Deviation: A Guide to Interpretation
The Importance of Standard Deviation in Statistics
Standard deviation is a crucial measure of **variability** in the field of statistics. It quantifies the amount of **dispersion** or **variation** present within a set of data points. When analyzing data, understanding how far individual **data points** deviate from the mean is essential for inferring deeper insights from your dataset. This measure not only helps in outlining the **importance** of data patterns but is also instrumental in practical applications such as **quality control**, **finance**, and **data analysis**. For instance, in finance, a high standard deviation indicates increased risk, making it vital for **risk assessment** in investment decisions.
Calculating Standard Deviation
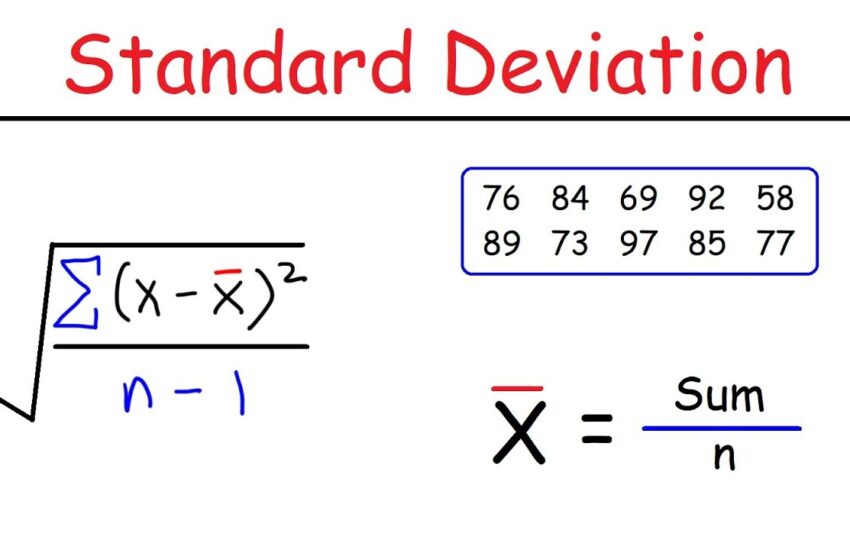
To calculate standard deviation, you first need to determine the mean (average) of your **data** set. The formula is:
1. Find the mean (\(\mu\)) of the data set.
2. Subtract the mean from each data point and square the result (this is called the squared deviation).
3. The average of these squared deviations is the variance (\(V\)).
4. Take the square root of the variance to find the standard deviation (\(\sigma\)).
Mathematically, this is represented as:
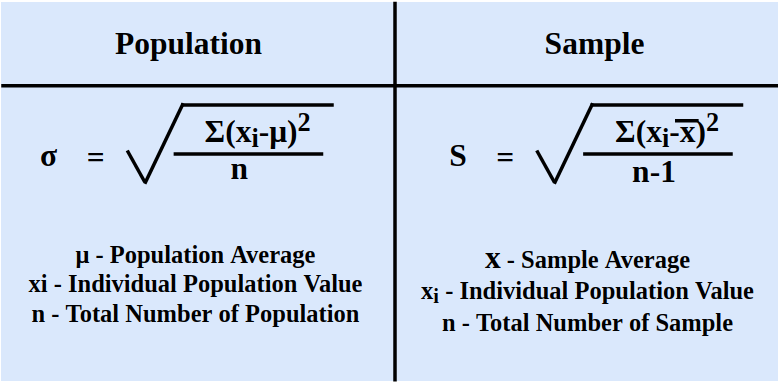
\(\sigma = \sqrt{\frac{\Sigma (x_i – \mu)^2}{N}}\) where \(x_i\) represents each data point and \(N\) is the total number of data points. This simple yet effective procedure highlights the **calculation** involved in determining the standard deviation. It’s notable that understanding the structural basis of this metric aids in better **data interpretation**.
The Role of Standard Deviation in Data Analysis
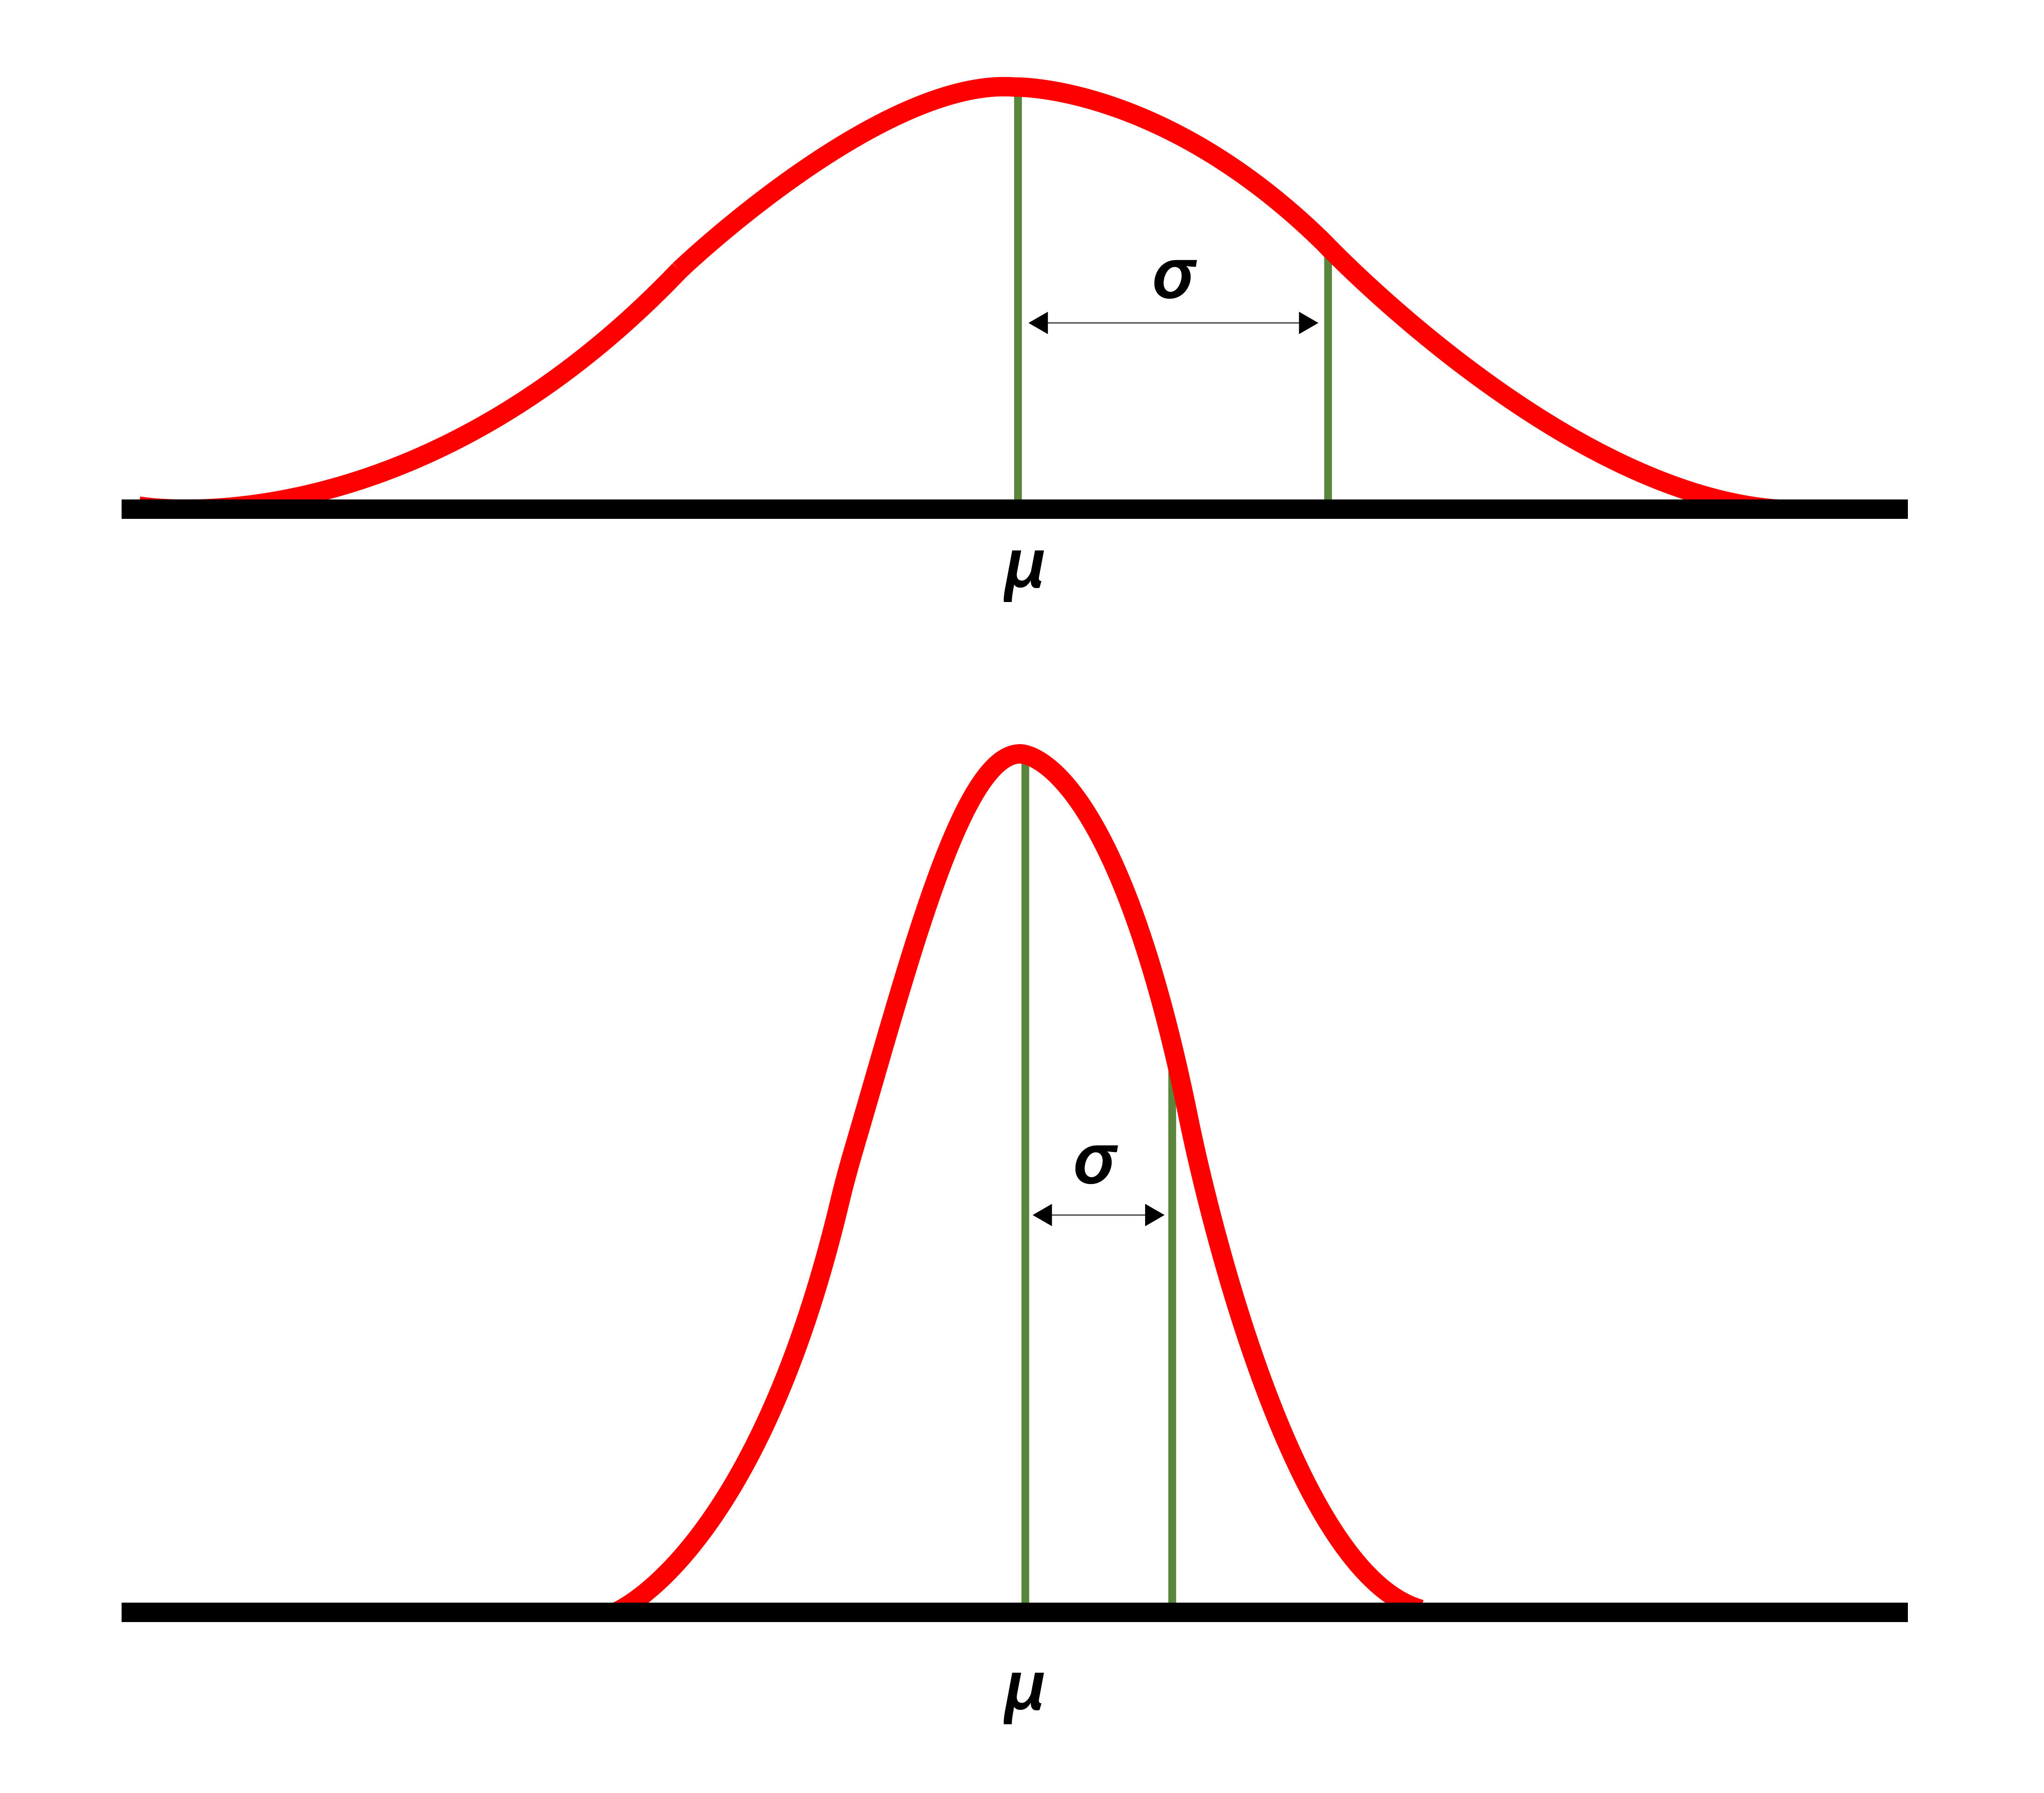
In the context of **data analysis**, standard deviation serves as an essential statistical tool for assessing the **variability** within datasets. When conducting analyses, recognizing the spread of your data around the mean informs whether your observations are close to the average or widely spread out. This insight is particularly vital when evaluating datasets for **normal distribution**, where a larger standard deviation implies significant diffusion around the mean—indicative of **quality assurance** issues or **data anomalies** like outliers. Thus, standard deviation is key in drawing conclusions based on **descriptive statistics**.
Interpreting Data with Standard Deviation
Understanding how to interpret standard deviation can greatly enhance your ability to conduct effective **quantitative research**. This measurement provides a perspective on the **variation** of your data set—employing insights derived from it can elevate your analysis to informed decision-making, be it in academic research or professional projects.
Standard Deviation in Quality Control
In fields such as **manufacturing**, **standard deviation** is extensively utilized in **quality control** to monitor production processes. By establishing control limits using standard deviations, organizations can easily identify deviations that signify potential issues. For instance, if a production metric deviates more than three standard deviations from the mean, it could indicate a serious quality problem prompting immediate attention. Such **measurements** ensure that processes remain consistent and products meet required performance metrics.
Normal Distribution and Standard Deviation
Standard deviation also plays a significant role when discussing **normal distribution**, which is foundational in statistics. In a perfect bell curve, approximately 68% of data falls within one standard deviation of the mean, 95% within two standard deviations, and 99.7% within three. This understanding enables statisticians and analysts to make **statistical inferences** and assess probabilities effectively, allowing them to make informed judgments about population parameters and offer more substantial **risk management** insights.
The Applications of Standard Deviation in Research
Standard deviation can profoundly influence research outcomes across diverse fields like finance, healthcare, and social sciences. The variance between data points can offer hints about overall trends, potential issues, or areas for improvement.
Standard Deviation in Finance
In the realm of **finance**, standard deviation is primarily employed to measure investment risk. A secure asset typically showcases a lower standard deviation, signifying it consistently delivers returns near the mean expected. Conversely, high-standard deviation assets are volatile, indicating substantial fluctuations in returns, important for investors in performing risk and **trend analysis**. Hence, knowledgeable investors consistently weigh the implications of these figures against their **investment strategies**.
Using Standard Deviation in Hypothesis Testing
In **hypothesis testing**, standard deviation becomes instrumental in determining the **statistical significance** of results. Lower standard deviations become a benchmark in suggesting that variations are not due to chance but are reflective of actual phenomena. Researchers must understand this concept for rigor in experimental design, particularly when validating the efficacy of different methods and approaches. Standard deviation aids in establishing confidence intervals, effectively placing boundaries on the estimations derived from sample data.
Best Practices for Interpreting Standard Deviation
While standard deviation is a fundamental concept, interpreting its results should be approached with care. Ensuring accuracy in assessments demands familiarity with applicable statistical methods and their interpretation.
Understanding Variance Analysis
Variance analysis is often paired with standard deviation, providing complementary insights into data **variability**. Observing both metrics helps not only in grasping overall dispersion but also in identifying **measurement error** that could skew results. By employing both standard deviation and variance, analysts cultivate proficiency in making robust statistical assessments and fostering enhanced operational strategies.
Utilizing Z-Scores for Data Interpretation
A practical tool for interpreting standard deviation is the **z-score**. A z-score indicates how many standard deviations a data point is from the mean, permitting easy identification of potential outliers. For example, if a z-score exceeds +/- 3, that data point is deemed an outlier. Integrating z-scores into your analysis can unveil broader insights for data **distribution** and contribute to robust data analysis frameworks.
Key Takeaways
- Standard deviation is key to understanding data variability and precision in statistical analysis.
- Calculating standard deviation involves determining the mean, variance, and then finding the square root of the variance.
- The illusion of normal distribution enhances the application of standard deviation in **data interpretation**.
- In fields like finance and quality control, standard deviation serves as a critical tool for decision making and risk assessment.
- Standard deviation should be used in conjunction with variance analysis and z-scores for robust data analysis.
FAQ
1. What does a high standard deviation indicate?
A **high standard deviation** indicates that the data points are widespread from the mean, suggesting greater variability within the data set. In practice, this may signify **higher risk** in financial settings or a broader range of performance in other quantitative analyses.
2. How do I know if my data is normally distributed?
You can assess **normal distribution** through graphical tools like histograms or statistical tests such as the Shapiro-Wilk test. If the data’s standard deviation matches the empirical rule surrounding its mean (68-95-99.7 rule), it is likely to be approximately normally distributed.
3. What is the difference between standard deviation and variance?
While both **standard deviation** and variance measure **variability**, variance is the average of squared deviations from the mean, whereas standard deviation is the square root of the variance. This means that standard deviation is expressed in the same units as the original data, making it more intuitive to interpret.
4. Can standard deviation be negative?
No, standard deviation cannot be negative since it is derived from squared values, which are always non-negative. A standard deviation of zero indicates that all data points are identical, while higher values indicate more variability.
5. How does standard deviation affect hypothesis testing?
In **hypothesis testing**, standard deviation is critical for establishing confidence intervals and assessing the significance of results. A smaller standard deviation indicates that your sample mean is likely close to the population mean, enhancing the reliability of the hypothesis test results.
###
Relevant Images