How to Effectively Calculate Standard Deviation in Excel
Calculating **standard deviation in Excel** is an essential skill for anyone dealing with data analysis. Whether you’re a student, a business analyst, or simply someone wanting to understand data patterns, knowing how to calculate standard deviation can help you measure variability in your dataset effectively. In this guide, we will explore various methods to determine **standard deviation in Excel** using its built-in functions.
Understanding Standard Deviation in Excel
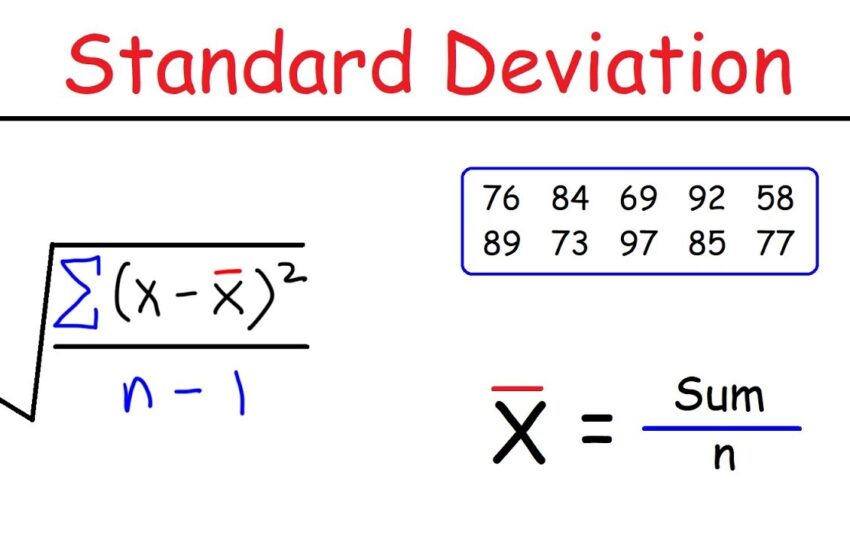
Before diving into the calculations, it’s crucial to understand what **standard deviation** is. In simple terms, it measures how spread out the numbers in a data set are. A low standard deviation indicates that the data points tend to be close to the mean, while a high standard deviation indicates that the data points are spread out over a wider range. To assess variability accurately, you will often employ **Excel statistical functions** designed to compute both variance and standard deviation easily.
Key Excel Functions for Standard Deviation
Excel provides several functions to calculate standard deviation. The choice of function can depend on the dataset type you’re analyzing. Here are the primary functions you can use:
- STDEV.P – This function is used when you have the entire population’s data.
- STDEV.S – This function is ideal for calculating the standard deviation of a sample from a larger population.
- STDEV – An older function that has been replaced by the S and P variants but remains available for compatibility.
For example, if you want to compute the standard deviation of a sample and your data range is A1:A10, you would enter the following in a new cell: =STDEV.S(A1:A10).
Getting Started: Using Standard Deviation in Excel
To begin calculating **standard deviation in Excel**, follow these practical steps:
- Open your Excel sheet and ensure your data is correctly entered in a column or row.
- Select an empty cell where you want the result to appear.
- Type the formula based on whether you are calculating the sample or population standard deviation. Use
=STDEV.S(range)or=STDEV.P(range). - Press Enter to view the calculated standard deviation for the specified dataset.
For enhanced accuracy, ensure that your data set does not contain empty cells or text values as these can affect your calculations. A thorough cleaning of your data should precede any statistical analysis.
Visualizing Standard Deviation in Excel
Understanding **standard deviation** can be enhanced by visualization. Excel provides tools to create charts that help you display your data’s variability. A common choice is the **standard deviation graph** which depicts the means and deviations within a visual format.
Creating a Standard Deviation Chart
To effectively convey variability in a dataset through visual means, you can utilize a bar or line chart combined with error bars representing the standard deviation:
- Select the data for which you wish to visualize the standard deviation.
- Navigate to the ‘Insert’ tab and choose either ‘Line’ or ‘Bar’ chart.
- Once the chart appears, click on it and choose ‘Add Chart Element’. From there, select ‘Error Bars’ and then ‘More Error Bars Options.’
- In the Error Bar settings, opt to customize your fixed value to represent the calculated standard deviation.
Visual aids like this not only facilitate understanding but also play an important role in **reporting standard deviation in Excel**, especially for presentations.
Interpreting Results: What Standard Deviation Tells Us
Once you have calculated your **standard deviation**, the next step is interpretation. For example, if you were analyzing exam scores and found a standard deviation of 10, this suggests that most scores are within 10 points of the average score. Recognizing this can be critical in decision-making, as it helps to highlight trends within your datasets.
Moreover, comparing standard deviation values across different datasets can help you identify which datasets are more variable. A higher standard deviation may prompt additional investigations into potential sources of variability.
Advanced Techniques in Calculating Standard Deviation
For users looking to deepen their analytical skills, exploring advanced techniques in **calculating standard deviation in Excel** can enhance your data analysis toolkit. Techniques could include using **Excel data analysis tools** such as the Analysis ToolPak for more complex statistics.
Using Excel’s Analysis Toolpak
Excel’s Analysis ToolPak offers an easy way to perform statistics including standard deviation calculations over complex datasets:
- First, ensure the Analysis ToolPak is enabled by going to ‘File’, then ‘Options’, and selecting ‘Add-Ins’. Under ‘Manage’, choose ‘Excel Add-ins’ and ensure that ‘Analysis ToolPak’ is checked.
- Once enabled, go to the ‘Data’ tab and click on ‘Data Analysis’.
- Select ‘Descriptive Statistics’ and check ‘Summary statistics’ to obtain standard deviation along with other valuable stats in a new output sheet.
This technique is particularly useful when dealing with multiple data sets or conducting a thorough statistical analysis in Excel.
Advanced Standard Deviation Formulas
Besides the basic Excel functions, you might find using more complex formulas beneficial, like combining standard deviation with other statistical measures. For example, you could calculate both mean and standard deviation together using a formula like this: =(SUM(A1:A10)/COUNT(A1:A10)&" → Std Dev: "&STDEV.S(A1:A10)). This gives you immediate insight into the data’s central tendency and variability.
Key Takeaways
- Understanding the difference between population and sample standard deviations is crucial when using Excel functions.
- Using visualizations can greatly enhance the communicative power of your standard deviation analysis.
- Excel’s Analysis ToolPak provides invaluable options for tackling complex data sets with ease.
FAQ
1. How do I calculate variance and standard deviation in Excel?
To calculate variance and standard deviation, use the functions VAR.S for sample variance and STDEV.S for sample standard deviation. For population statistics, use VAR.P and STDEV.P respectively.
2. Are there shortcuts to calculate standard deviation in Excel?
Yes, shortcuts like the Excel function bar can help you input formulas faster. Additionally, creating named ranges for your datasets can speed up the calculation process.
3. Can I calculate standard deviation for multiple datasets at once?
You can calculate standard deviation for multiple datasets by applying the STDEV function on each dataset individually or utilizing pivot tables to summarize multiple data ranges.
4. How do I interpret a high standard deviation value?
A high standard deviation means greater variability in your data set, indicating that data points are widely spread out from the mean. This might suggest inconsistencies or varied outcomes, prompting a deeper analysis.
5. What if my Excel dataset contains errors? How will it affect standard deviation?
Errors such as text entries or empty cells will distort calculations. It is crucial to clean and validate your dataset before applying any statistical functions to ensure accurate results.
6. Is it possible to visualize multiple standard deviations in Excel?
Yes! By using grouped bar charts or line charts with error bars, you can visualize different datasets’ standard deviations to compare their variability visually.
7. What function can I use for a quick calculation of standard deviation?
The quickest way is to use the command STDEV.S() for samples or STDEV.P() for populations, providing a straightforward calculation in a single formula entry.

