How to Effectively Calculate Mean in Excel for Accurate Data Analysis in 2025
Understanding Mean in Excel
Calculating the **mean** is a fundamental component of data analysis that can provide crucial insights into your datasets. In Excel, the **mean formula** is simple yet powerful, allowing you to process large sets of data efficiently. To understand this better, the mean, or average, represents the central value of a dataset and is calculated by summing all the numbers in a dataset and dividing by the count of those numbers. Mastering how to calculate mean in Excel not only enhances your data analysis skills but also streamlines your workflow, making Excel an indispensable tool for professionals in 2025 and beyond.
Using the Excel Average Function
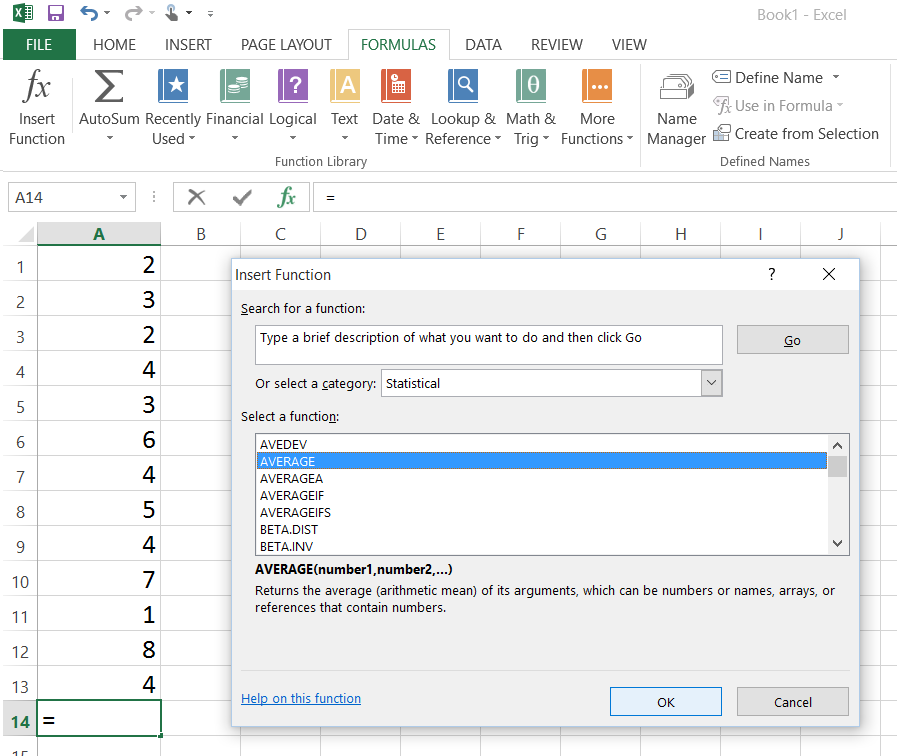
One of the most straightforward ways to **calculate average** in Excel is by using the built-in **AVERAGE function**. By simply typing `=AVERAGE(range)` in a cell, you can quickly find the mean of a designated range of cells with numbers. For instance, if your data lives in cells A1 to A10, you would enter `=AVERAGE(A1:A10)`. This method guarantees precision, as it applies the mean **formula** across all specified cells. Not only does this save time, but it also reduces the potential for human error.
Understanding Excel’s Statistical Functions
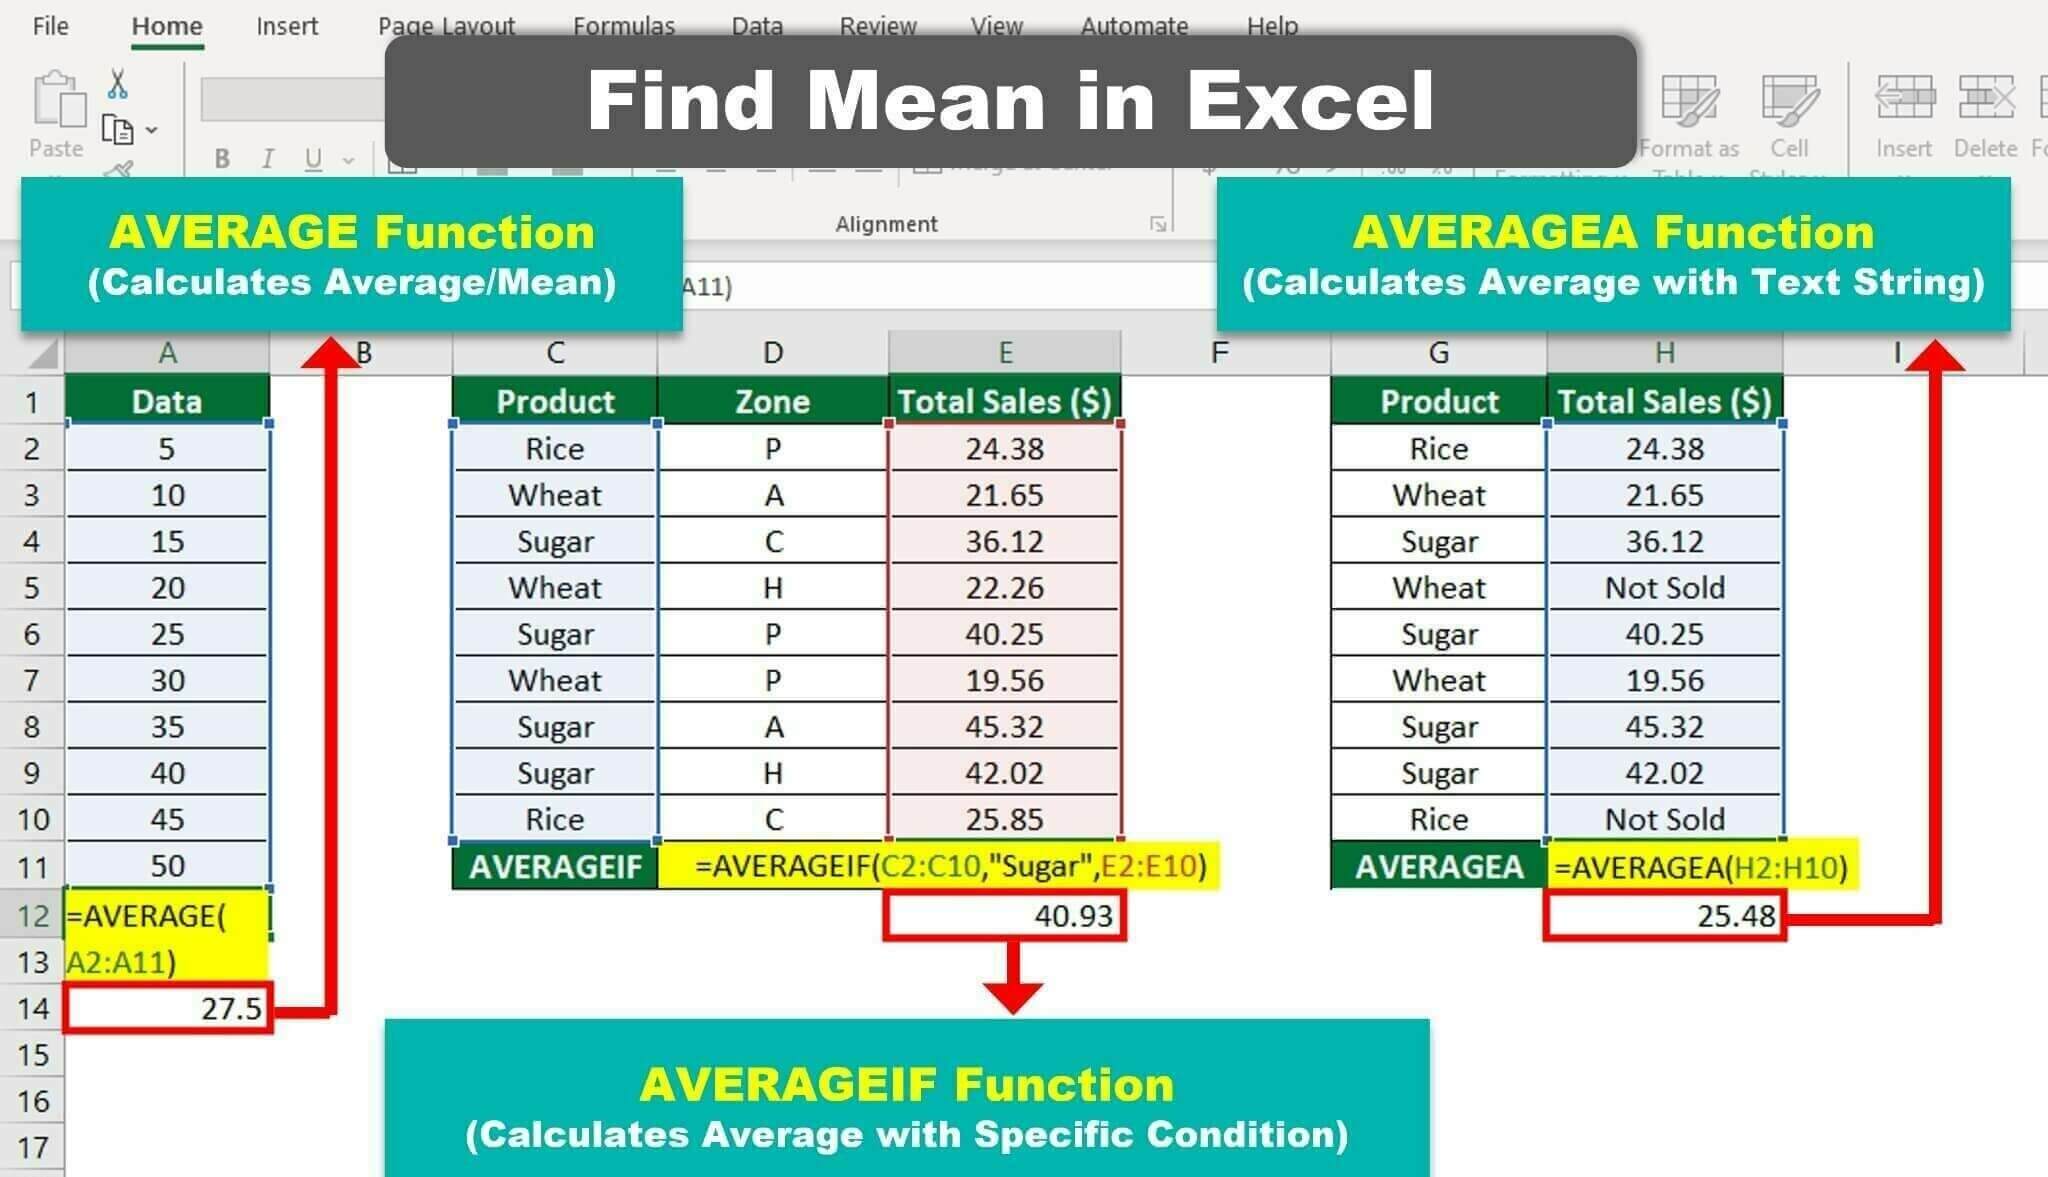
Excel comes with a variety of **statistical functions** that enhance your analytical capabilities. The **mean in spreadsheets** can be computed using other functions as well, such as **AVERAGEIF** and **AVERAGEIFS**, which calculate the mean based on specific criteria. For example, `=AVERAGEIF(B1:B10, “>50”)` calculates the mean of the cells in the range B1 to B10 that are greater than 50. This function allows you to perform dynamic mean calculations suited for various analytical scenarios, showcasing Excel’s versatility in handling data.
Practical Example: Mean Calculation in Excel
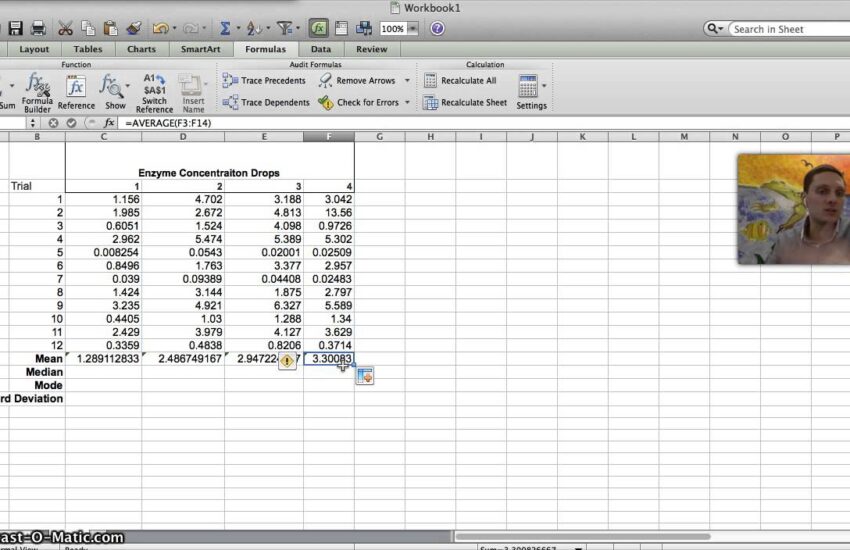
To illustrate the process of how to find mean effectively, let’s consider a practical case. Assume you have a dataset consisting of students’ scores in a test, listed in cells A1 through A10. To compute the **mean**, you would follow these steps:
- Click on a new cell where you want the mean result to appear.
- Type the formula:
=AVERAGE(A1:A10), and press Enter. - Excel will immediately return the mean value of the scores.
This step-by-step guide simplifies the process of mean calculation, ensuring accurate results that reflect true data interpretation. Moreover, practicing this approach with various datasets enhances your skills in Excel calculations, reinforcing your command over statistical operations.
Visual Tools for Data Analysis
Excel also provides visual tools, such as **charts and graphs**, which can complement mean calculations by depicting data distributions. Including a chart that represents these averages can deepen your understanding and provide clearer insights. For example, using **Histograms** can show how your data values cluster around the mean. When reading statistical results, visually mapping these values can help in data interpretation, making it easier to understand trends and patterns within your dataset.
Leveraging Excel for Comprehensive Data Analysis
Excel is not just for basic calculations; it’s a robust platform for complete **data analysis**. You can utilize various functions and tools within Excel to analyze large datasets comprehensively. By incorporating the mean and other statistical measures, users can determine data trends, assess variability, and visualize data effectively. Implementing more advanced analytical techniques such as regression analysis or pivot tables can further enhance your ability to extract meaningful insights.
Exploring Excel Data Functions
Another crucial aspect of data analysis in Excel is understanding its diverse range of **data functions**. Functions like **SUM, COUNT, and COUNTA** play supportive roles in performing deeper statistical operations. For instance, to compute the mean using the SUM and COUNT functions, the formula would be `=SUM(A1:A10)/COUNT(A1:A10)`. This alternative approach can be particularly useful when you want more control over the components of your calculations, enhancing clarity and strategic planning.
Best Practices for Excel Mean Calculation
When performing **mean calculations**, consider these best practices to ensure accuracy and reliability in your analysis:
- Prepare your data: Ensure data is clean and devoid of erroneous entries before calculation.
- Use range names: Implement named ranges for better readability, making referencing easier.
- Document your calculations: Keep notes on how you calculated the mean and the data used, which can help others understand your process.
By adopting these practices, you can not only enhance your credibility but also ensure the reproducibility of your analyses moving forward.
Key Takeaways
- Using the **AVERAGE function** simplifies mean calculations in Excel.
- Excel supports various **statistical functions**, offering flexibility in calculating means based on criteria.
- Visualization tools within Excel provide supplementary insights, improving data interpretation.
- Employing best practices ensures accurate analyses and enhances your credibility in professional settings.
FAQ
1. What is the **mean formula** in Excel?
The **mean formula**, commonly used in Excel, is =AVERAGE(range). This formula computes the average of all numbers within the specified range of cells, facilitating quick data assessments and analysis.
2. How can I calculate *mean* for specific conditions?
You can utilize the **AVERAGEIF** function in Excel to calculate means based on specific criteria. For instance, =AVERAGEIF(B1:B10, ">50") computes the mean of numbers in the range B1 to B10 that meet the condition of being greater than 50.
3. Can I apply the mean calculation on non-numeric data?
No, mean calculations in Excel can only be performed on ranges that contain numeric data. Non-numeric data points will be excluded from the calculation, and care must be taken to clean the dataset beforehand.
4. What steps can I take to ensure accurate mean calculations?
To ensure accuracy, you should check for errors in your dataset, use named ranges for clarity, document your formulas carefully, and regularly audit your calculations against a subset of your data to verify results.
5. Are there any visual tools in Excel to help interpret the mean?
Yes, Excel offers several visualization tools, such as charts and graphs, which can help present average calculations clearly. Visual representations, such as histograms, can depict data distributions around the mean, aiding in better understanding and analysis.
6. Is there a quick way to calculate *average value* in Excel without using the formula?
Yes, after selecting a range of cells, you can quickly view the average value in the status bar at the bottom right corner of your Excel window, which displays the mean, sum, and count of the selected cells even without inputting a formula.