“`html
Effective Ways to Find Standard Deviation on Excel: Updated 2025 Guide
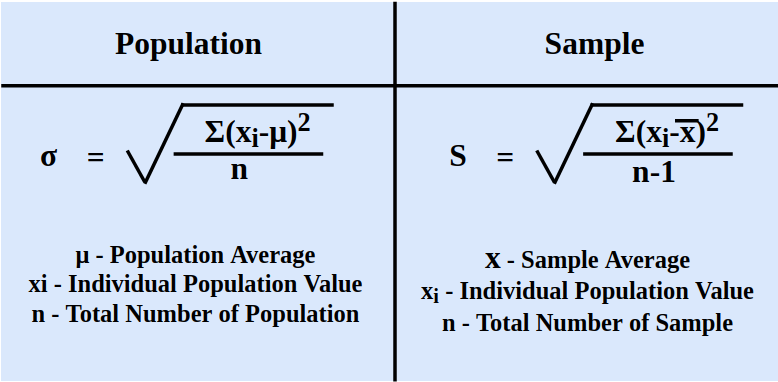
Understanding the Standard Deviation Formula
Standard deviation is a statistical measure that quantifies the amount of variation or dispersion in a set of values. This metric is crucial in statistics as it helps you understand how spread out the data points are in relation to the mean or average. If you want to calculate standard deviation in Excel, it’s important to grasp both the *standard deviation formula* and its practical applications. Excel offers different functions for standard deviation, catering to different data sets—these include the *STDEV.P* function for population and the *STDEV.S* function for samples. Knowing when to use each one ensures accurate results, defining how you interpret variability.
Population vs. Sample Standard Deviation
One of the first choices you’ll face when you want to find standard deviation in Excel is deciding whether your data represents the entire population or just a sample. The *population standard deviation* considers the totality of data, while the *sample standard deviation* is used for a smaller subset. To use Excel for these calculations, remember: STDEV.P is applied when your data encompasses the whole population, whereas STDEV.S is appropriate for a sample.
Using the STDEV in Excel
The Excel STDEV function simplifies finding standard deviation. By entering your data into a worksheet, you apply the function by typing =STDEV.S or =STDEV.P followed by the data range. In Excel, you can also drag to select data rather than typing every cell reference. For instance, =STDEV.S(A1:A10) calculates the sample standard deviation for data in cells A1 through A10, enabling quick and efficient Excel calculations without manual computation.
Common Excel Functions for Data Analysis
Excel provides a wide variety of statistical functions beyond just standard deviation. When conducting Excel data analysis, you might also explore variance alongside standard deviation. The relationship between variance and standard deviation helps provide a more comprehensive understanding of your data distribution. For example, variance is the average of the squared differences from the mean, and you can find it in Excel using the VAR.P or VAR.S functions. Understanding how to manipulate these functions is essential for precise data analysis.
Implementing Standard Deviation in Excel Data Analysis
To fully exploit *Excel’s statistical functions*, proper implementation in your data analysis is crucial. Being skilled in using different features of Excel lets you manage data effectively while achieving better insight through calculations like standard deviation. For instance, if you’re analyzing survey results, using standard deviation helps gauge how varied respondents’ views are. The applicability of Excel statistical functions is also heightened when data sets are large or complex, as they help highlight trends and deviations that might not be immediately visible.
Creating Data Visualizations for Better Insights
When it’s time to present your findings from an Excel data analysis, employing graphical representations can elevate understanding. Creating charts or graphs, such as histograms, to display the distribution of your data provides a visual context for the standard deviation you’ve calculated. Through visual aid, stakeholders can quickly see data concentration and trends, reinforcing the conclusions derived from your computations. Utilizing functions like *COLUMN AB** to excel in graphics enhances not just the analysis but the appeal and clarity of your data-driven insights.
Case Study: Analyzing Sales Data
Let’s take a practical example: Suppose you worked in sales and you need to analyze monthly sales data using Excel for data analysis. After gathering the data, you can calculate the standard deviation to measure sales performance consistency across different months. By using =STDEV.S(B2:B13) for the monthly sales data in range B2 to B13, you get insight into how fluctuating sales impacts overall performance. As you compare standard deviation over months, you’ll come across trends, likelihoods, and correlations that facilitate **data-driven decisions** for management strategies.
Automation and Error Checking in Excel Calculations
Automating analyses using features like macros and scripting can save tremendous time and minimize human error. When you build your worksheet integrating Excel calculations for standard deviation and variance, consider conducting regular checks to ensure data integrity and accuracy. Excel’s built-in tools allow for error checking that narrates diversions and discrepancies in standard deviation calculations, giving you confidence in the reliability of your analyses in a rapidly changing data landscape.
Advanced Excel Functions for Statistical Analysis
Diving deeper into statistical analysis, Excel houses impressive features that can further enhance your understanding and application of statistics. Functions like *Z-tests* or *t-tests* complement your statistical toolkit, helping to draw comparisons or assess the significance of your findings based on the standard deviation you’ve calculated. The ability to merge these functions with standard deviation gives more depth and clarity to your analytical reports.
Effective Use of Excel Charts for Statistical Data
Visual representation of your data through Excel graphs is not merely about aesthetics—it improves accessibility and comprehensibility for audiences who may not be familiar with complex statistical principles. When you visualize standard deviation, selecting the right type of chart can guide analysis; for instance, box plots clearly express how the data is distributed and pinpoint outliers. Learning the best practices for charting is key to ensuring that your data speaks effectively during presentations.
Integrating Statistical Tools in Excel for Enhanced Decision-Making
Finally, mastering the use of statistical tools within Excel, like pivot tables and advanced statistical functions, can elevate your analyses to inform high-stakes decisions efficiently. If you work in environments reliant on thorough statistical understanding—like finance or research—being adept in Excel equips you to deliver insights backed by rigorous data analysis seamlessly. It’s not just about crunching numbers; it’s about harnessing Excel’s power to derive actionable strategies that impact your organization positively.
Key Takeaways
- Understanding the differences between sample and population collections ensures accurate standard deviation calculations.
- Utilizing Excel functions like STDEV.S and STDEV.P streamline statistical analysis and improve efficiency.
- Visualizing data through Excel charts enhances comprehension and supports data-driven arguments.
- Embedding automation and error checking in your worksheets confirms the reliability and accuracy of calculations.
- Employing advanced statistical tools enriches analyses and facilitates informed decision-making in business scenarios.
FAQ
1. How do I calculate variance in Excel?
To calculate variance in Excel, you can use the VAR.P for population data or VAR.S for sample data. For example, if your data is in cells A1 through A10, type =VAR.S(A1:A10) to get the sample variance efficiently. This understanding aids your efforts in both variance and standard deviation computations.
2. Can I automate standard deviation calculations in Excel?
Yes, by using macros or Excel scripting tools, you can automate the process for standard deviation calculations. This is particularly useful when dealing with large datasets to avoid human error and speed up the analysis, enabling efficient use of Excel’s computational power.
3. What’s the significance of standard deviation in business analysis?
Standard deviation is vital in business analysis as it helps identify variances within sales, financial forecasts, and performance metrics. Understanding whether your data is consistent or shows significant fluctuations provides key insights for strategic decision-making and risk management.
4. How does Excel help in statistical modeling?
Excel serves as a robust platform for statistical modeling, providing various tools and functions for calculating advanced statistics, generating data visualizations, and leveraging those insights for predictive analytics. This multifaceted approach enhances analytic capabilities across numerous scenarios in business and research.
5. What is the importance of understanding statistics when using Excel?
Understanding statistics is crucial when using Excel because it allows you to interpret data correctly and employ functions effectively. Knowledge of statistical concepts ensures that analyses are grounded in accuracy, ultimately making your reports more reliable and insightful.
“`